Resume || Sample Maps || Travels

Sample Maps

https://shanepowell2003.tripod.com/sitebuildercontent/sitebuilderpictures/county_seats.jpg (393539 bytes)


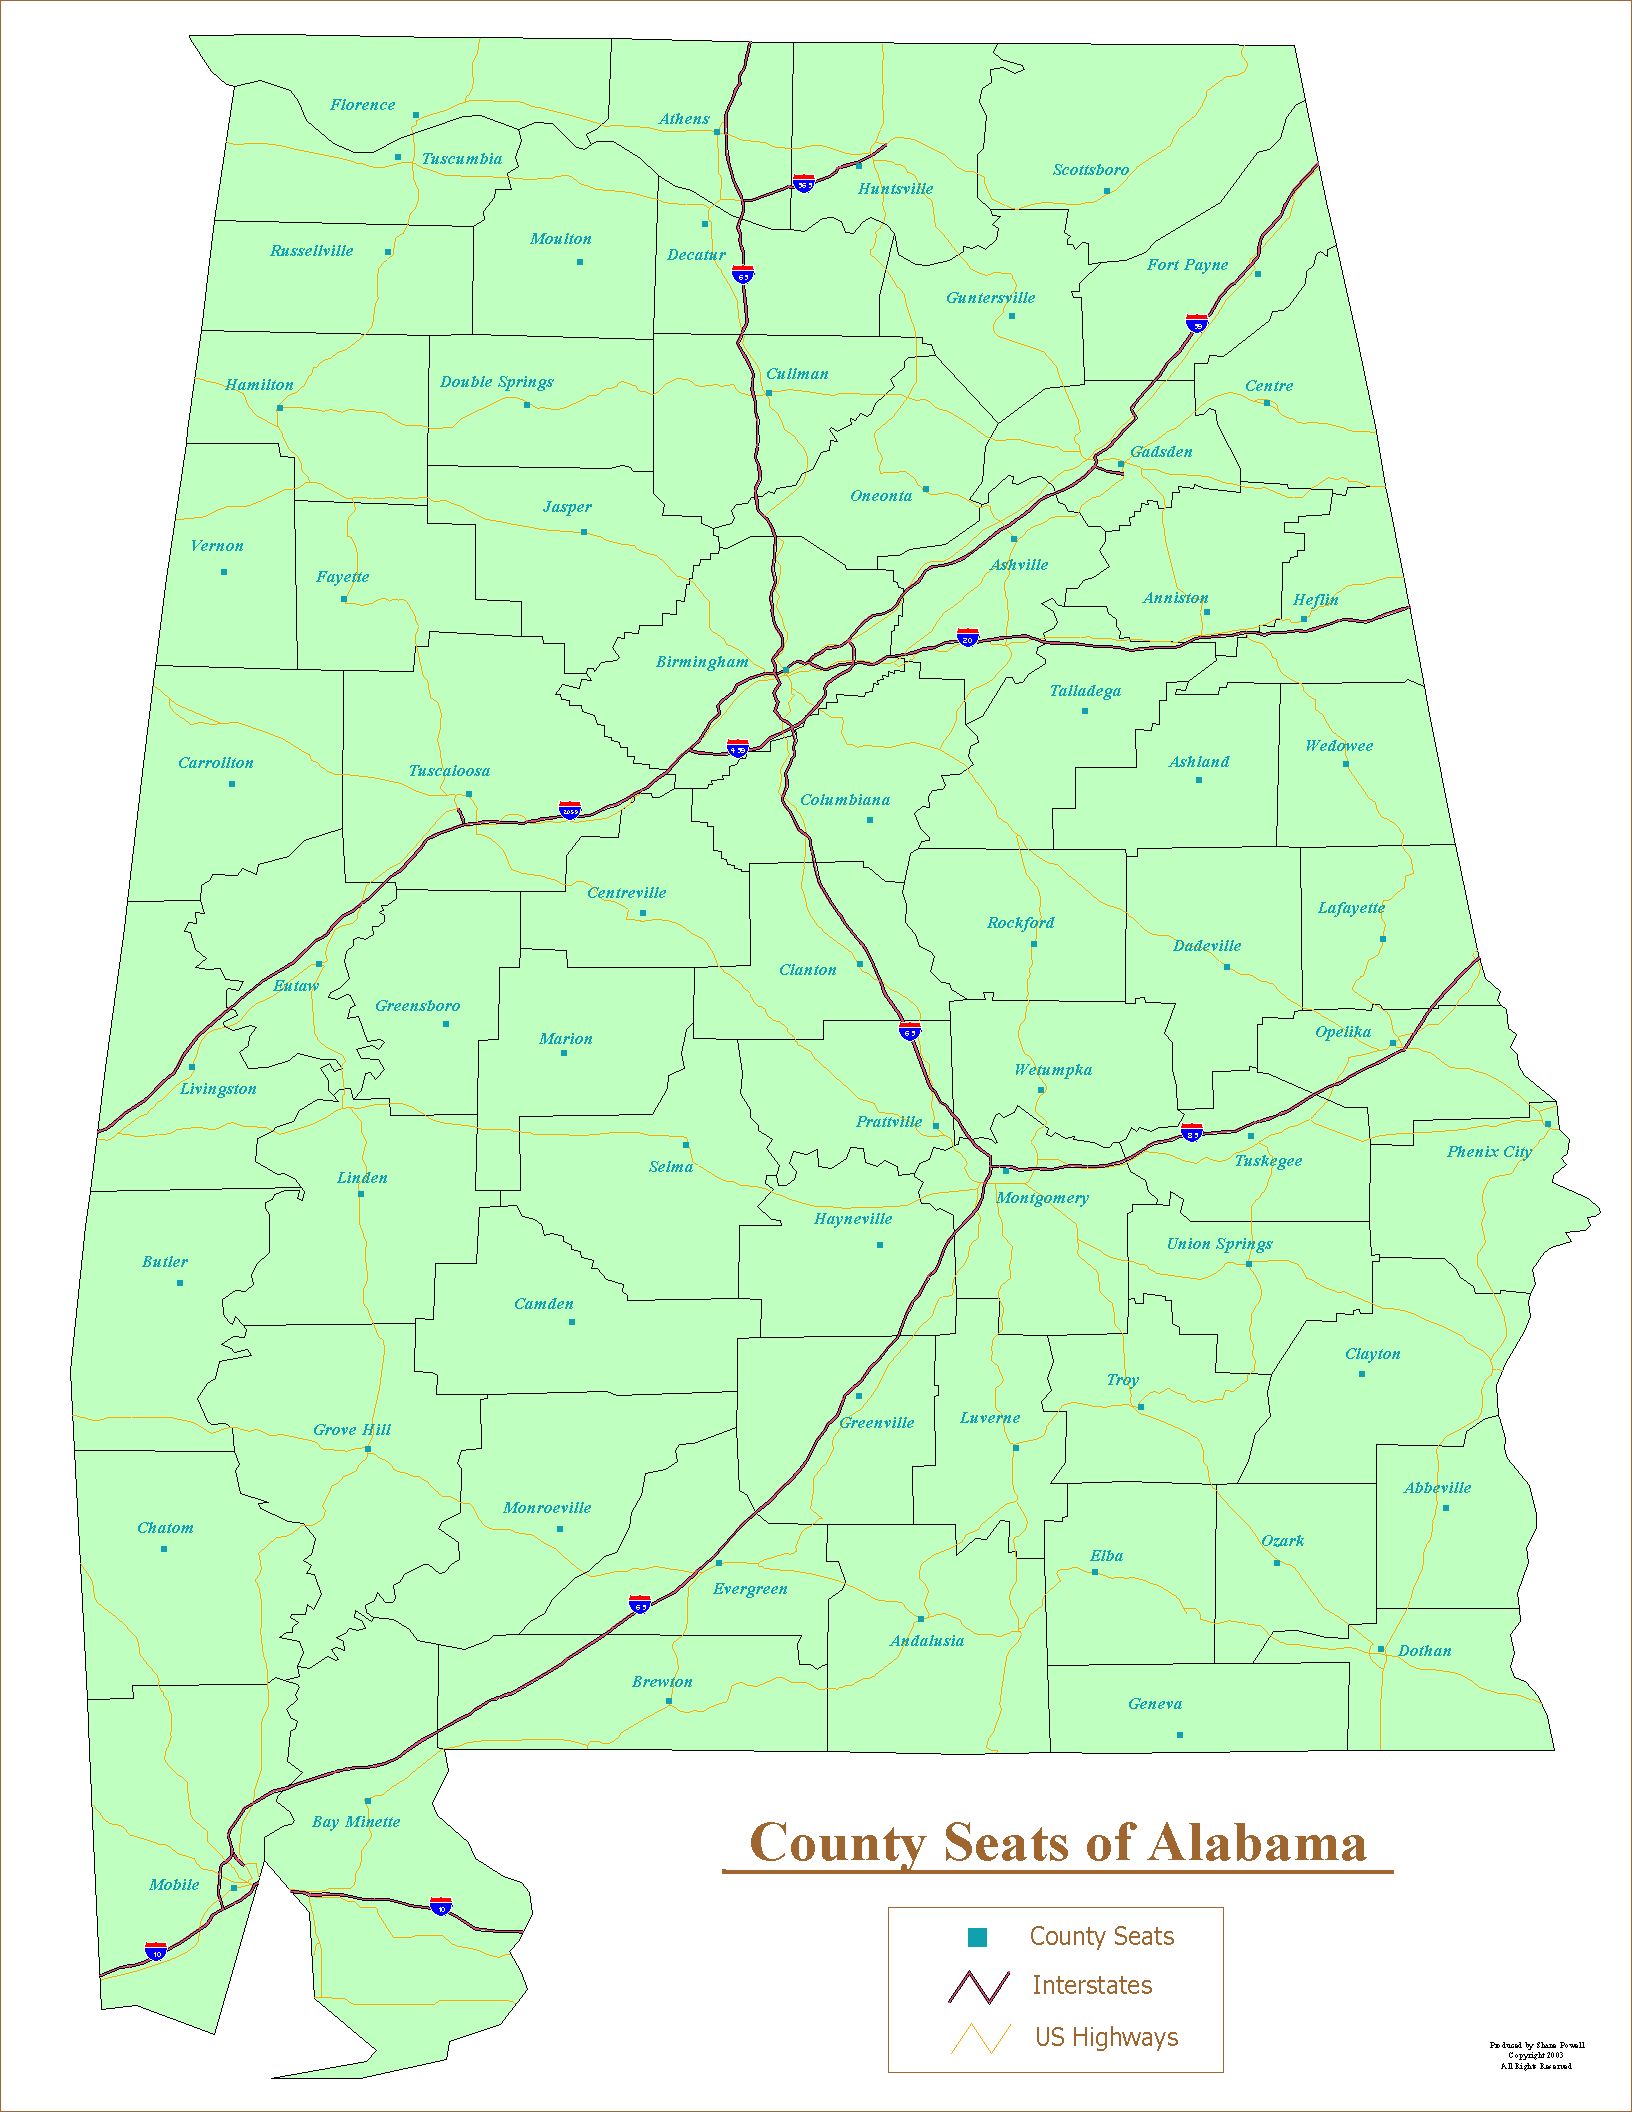
Alabama County Seats

The map contains:

  • County seats and boundaries for all 67 Alabama counties

  • Interstates and US Highways for the state


https://shanepowell2003.tripod.com/sitebuildercontent/sitebuilderpictures/license_plate.jpg (368120 bytes)

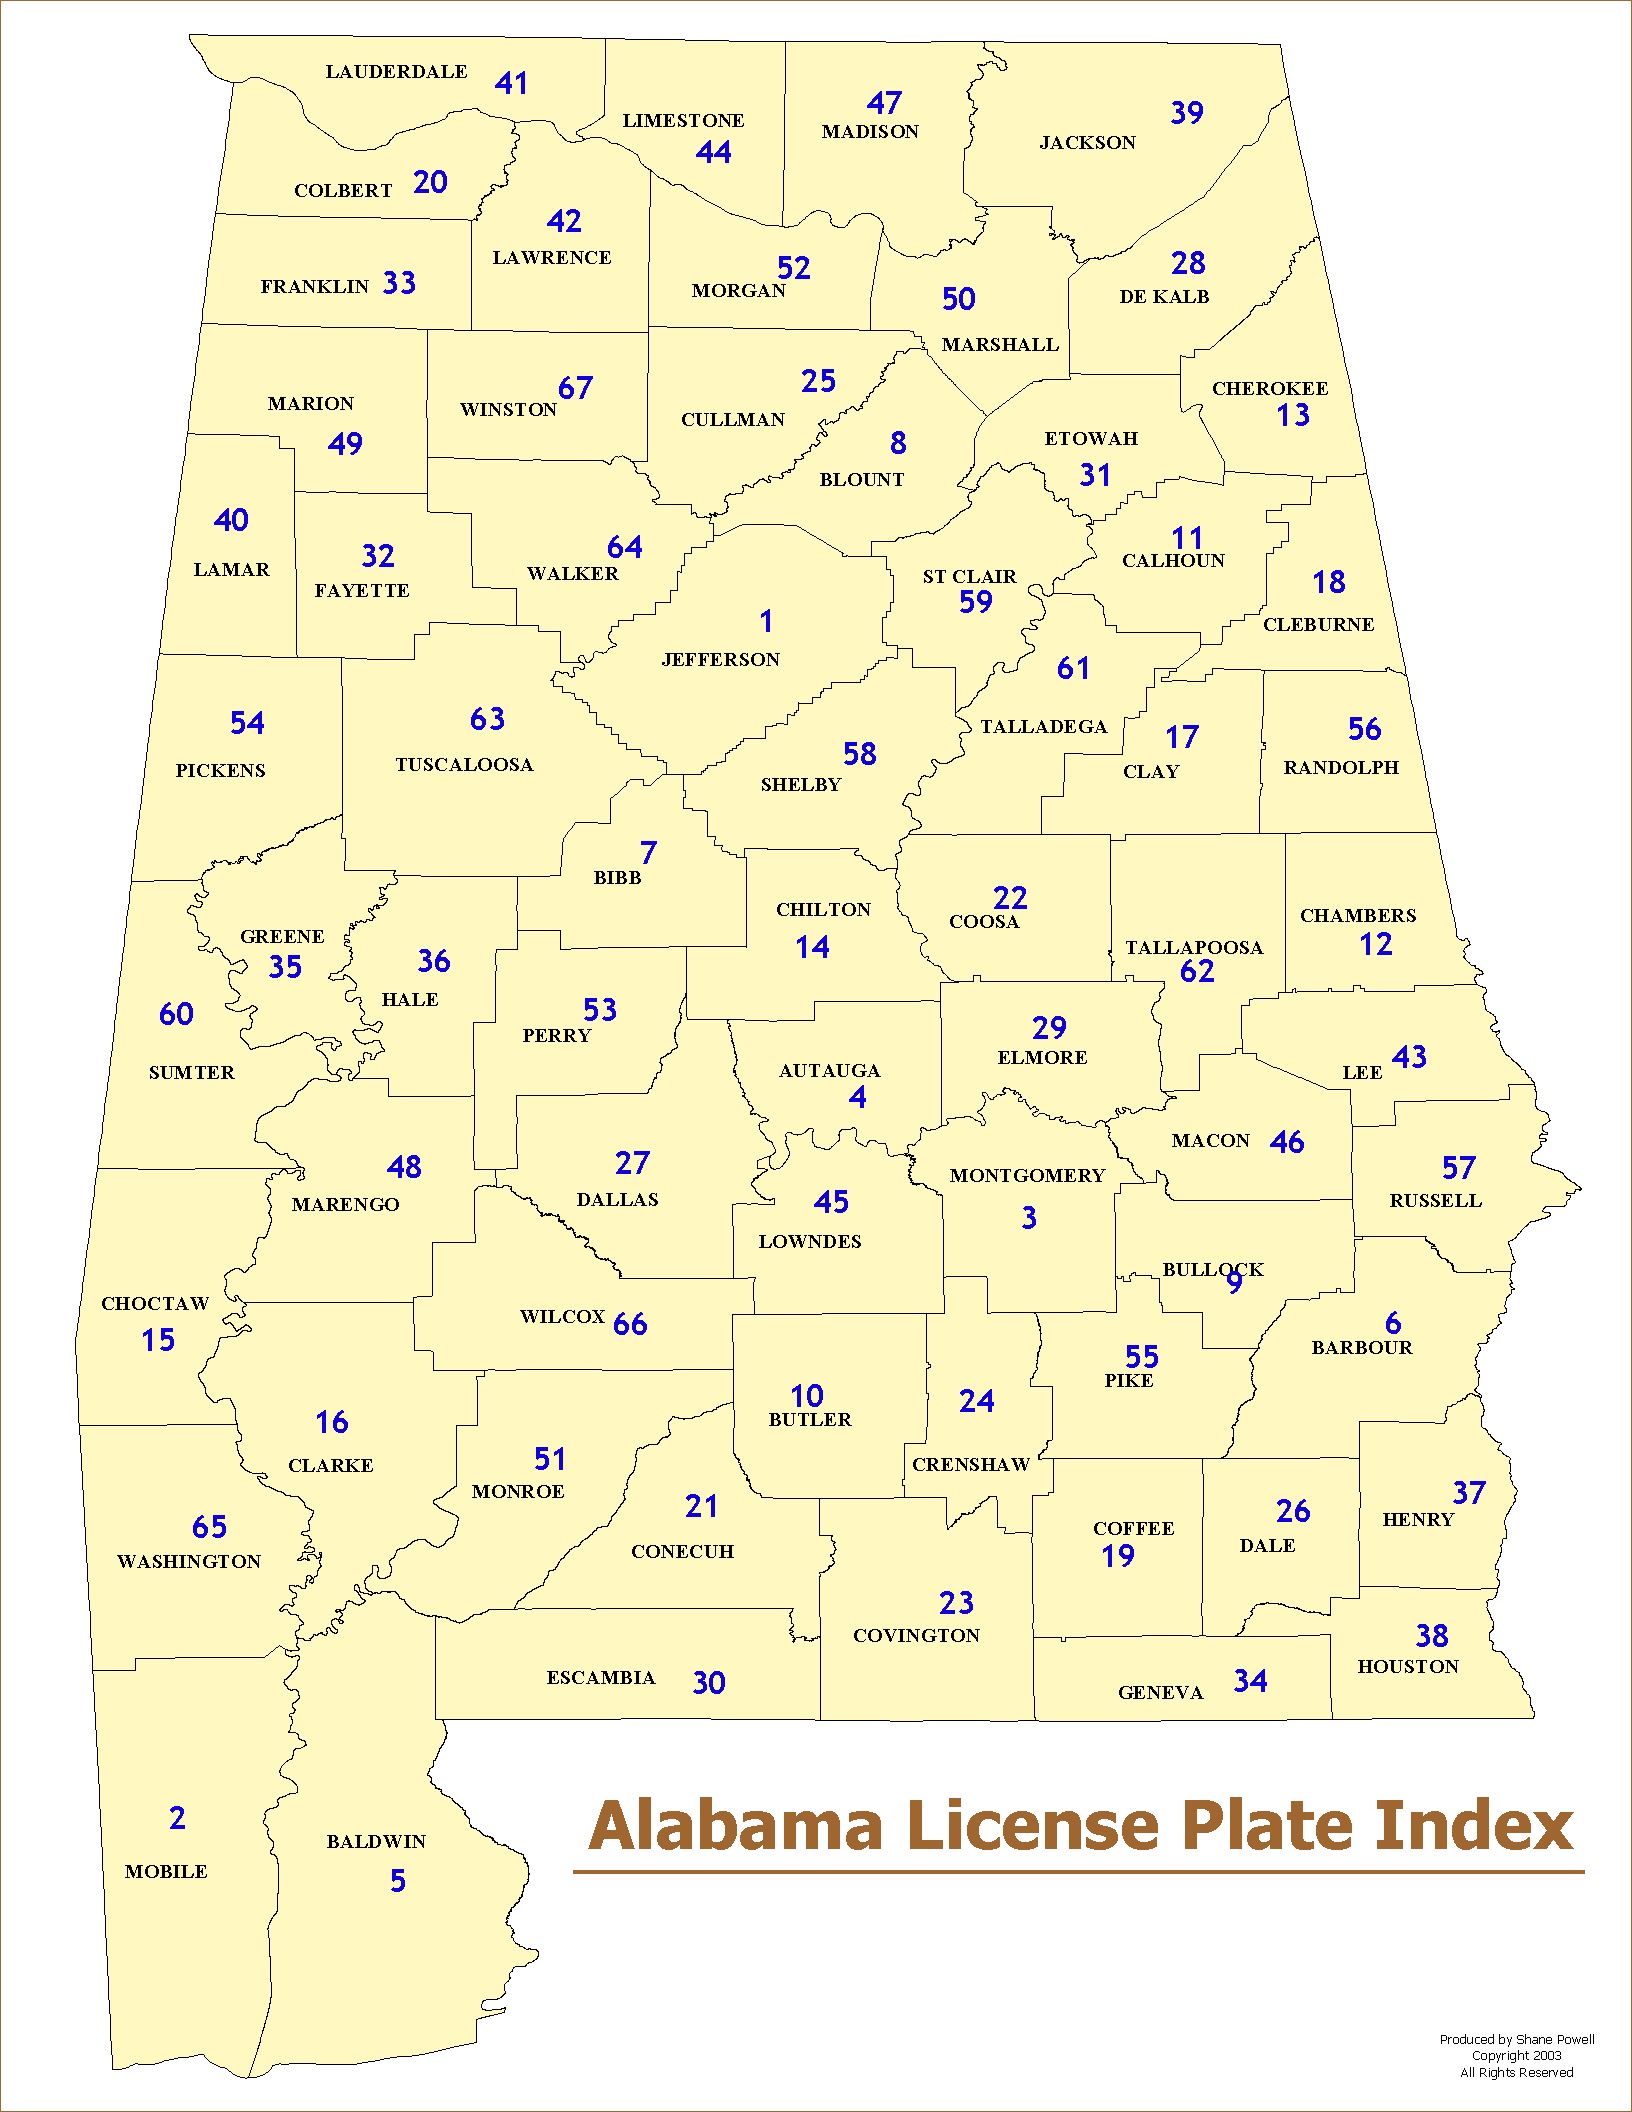
Alabama License Plate Index

The map contains:

  • Alabama counties labeled with both name and license plate index number


https://shanepowell2003.tripod.com/sitebuildercontent/sitebuilderpictures/alcohol_sales.jpg (649857 bytes)

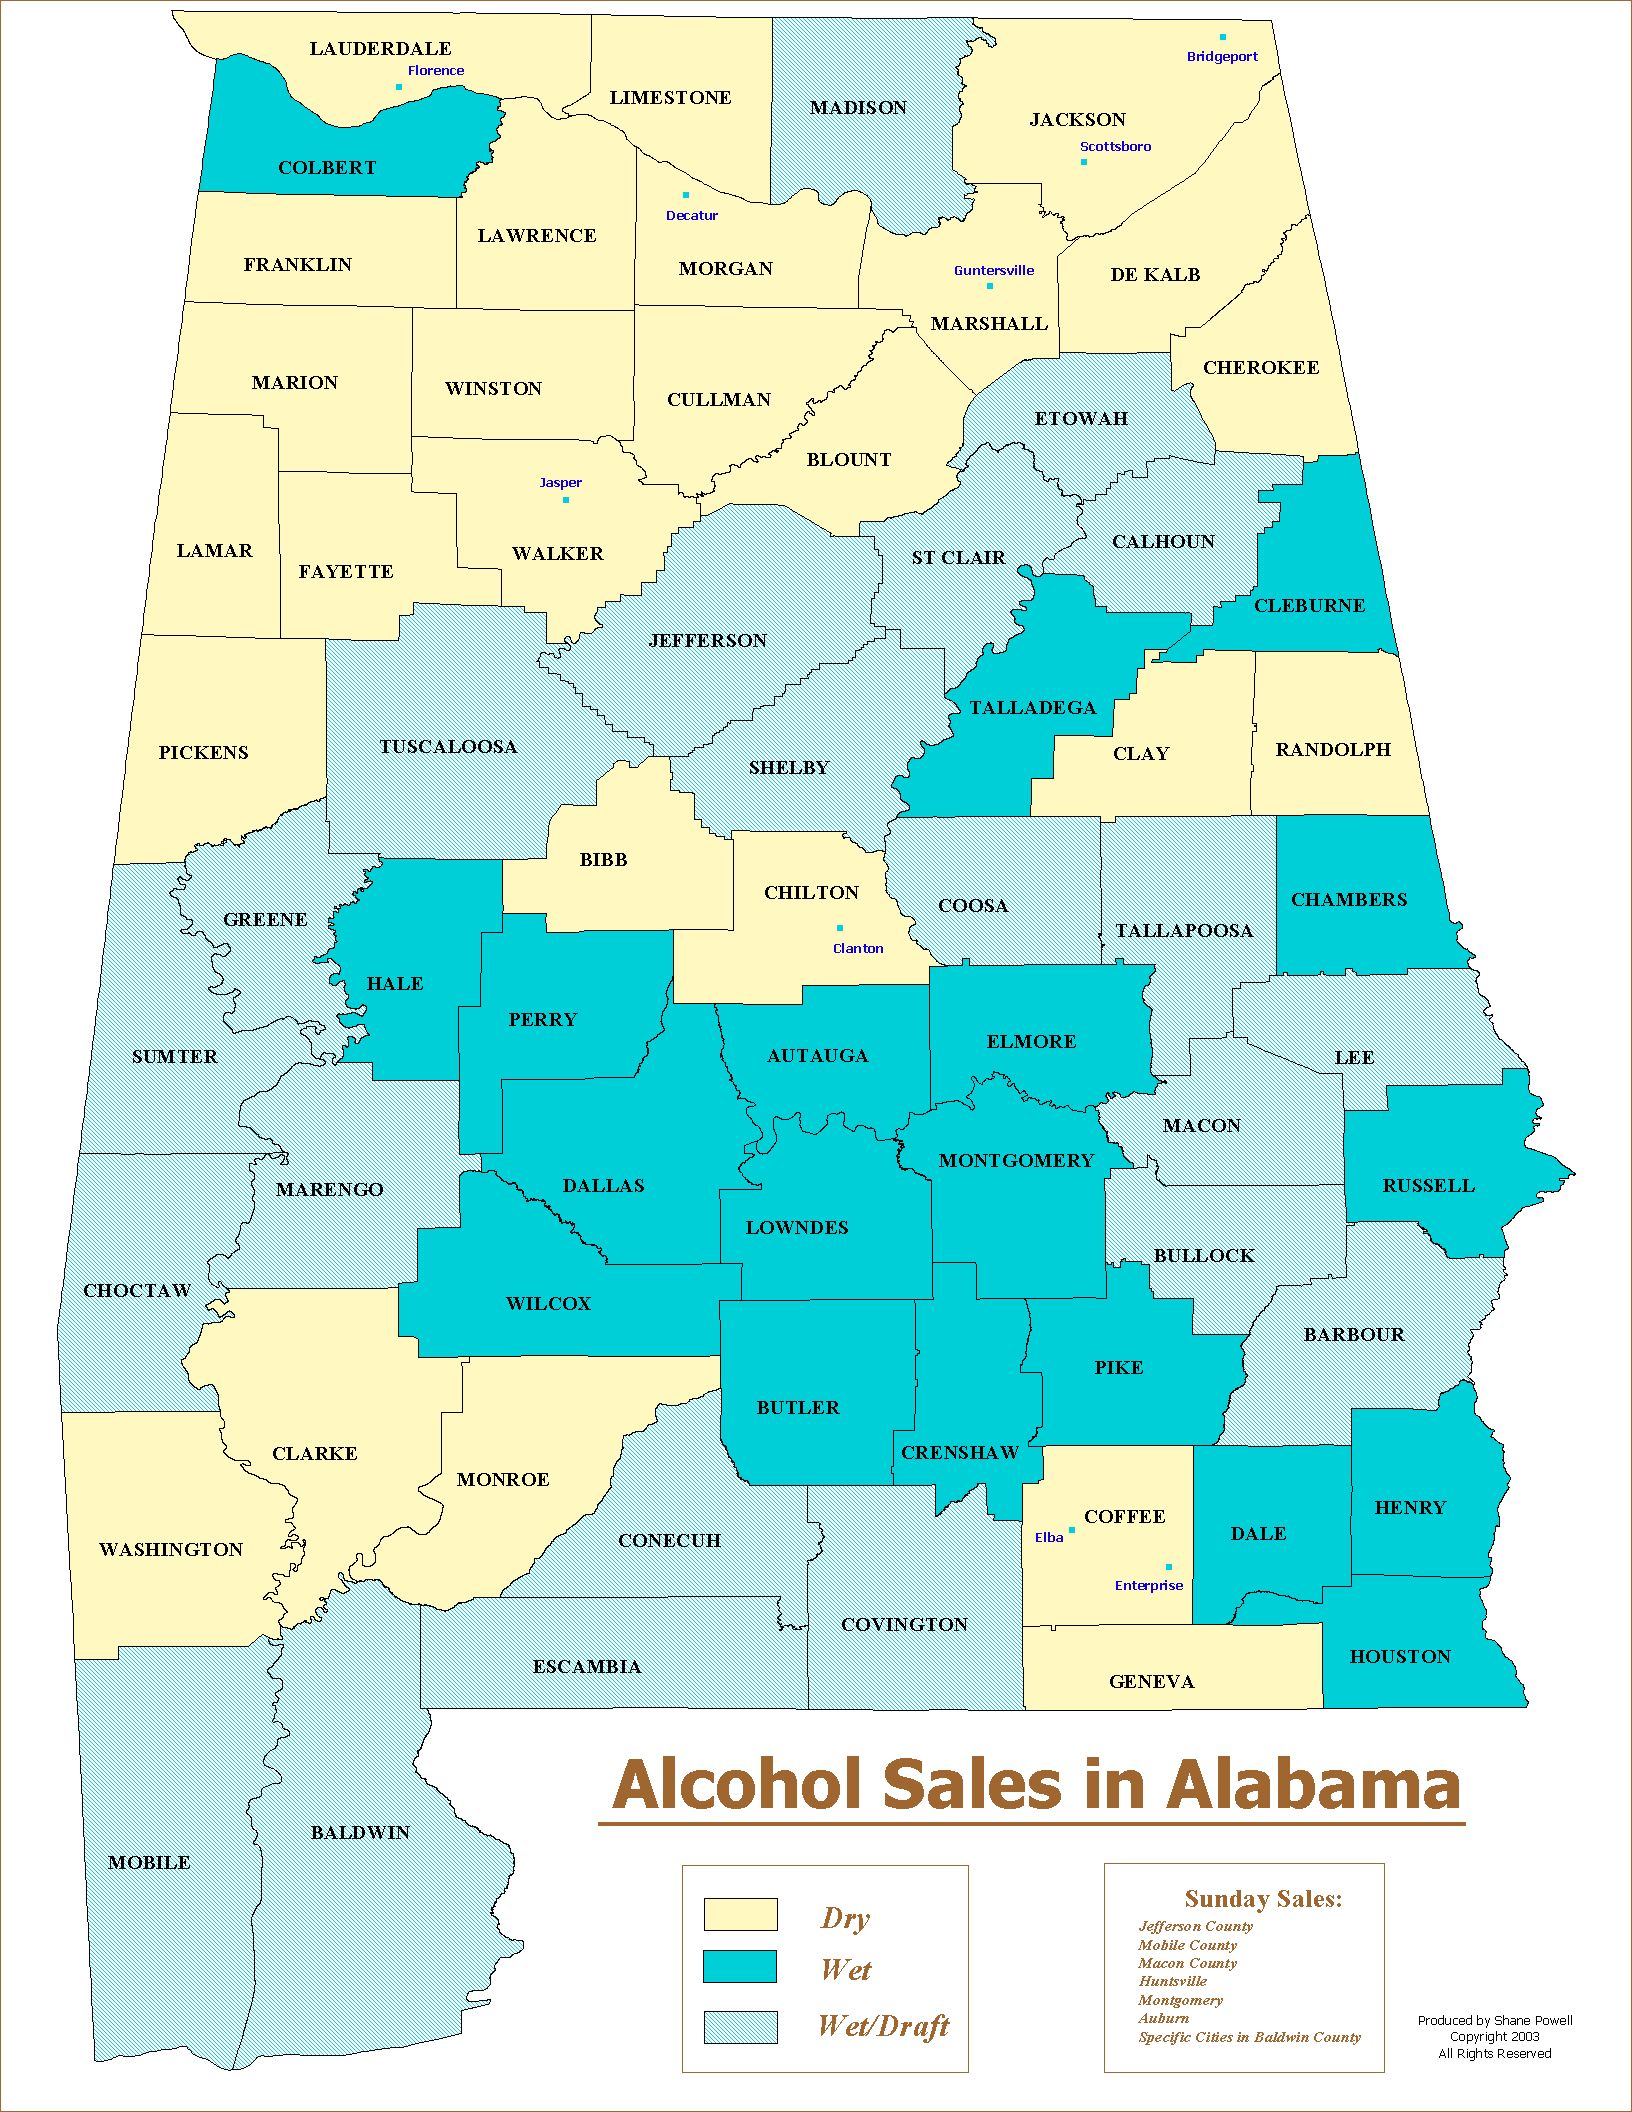
Alcohol Sales in Alabama

The purpose of the map is to show the counties in the state that do not allow alcohol to be sold within the county limits or "dry", that allow the sell of alcohol, but not draft beer in establishments or "wet", and those that allow the sell of all types of alcohol, including draft beer.

The map contains:

  • Counties differentiated in color/style by sale of alcohol (wet/dry/wet with draft)

  • List of counties and municipalities that allow for sale of alcohol on Sundays


https://shanepowell2003.tripod.com/sitebuildercontent/sitebuilderpictures/counties_race_pct.jpg (584451 bytes)

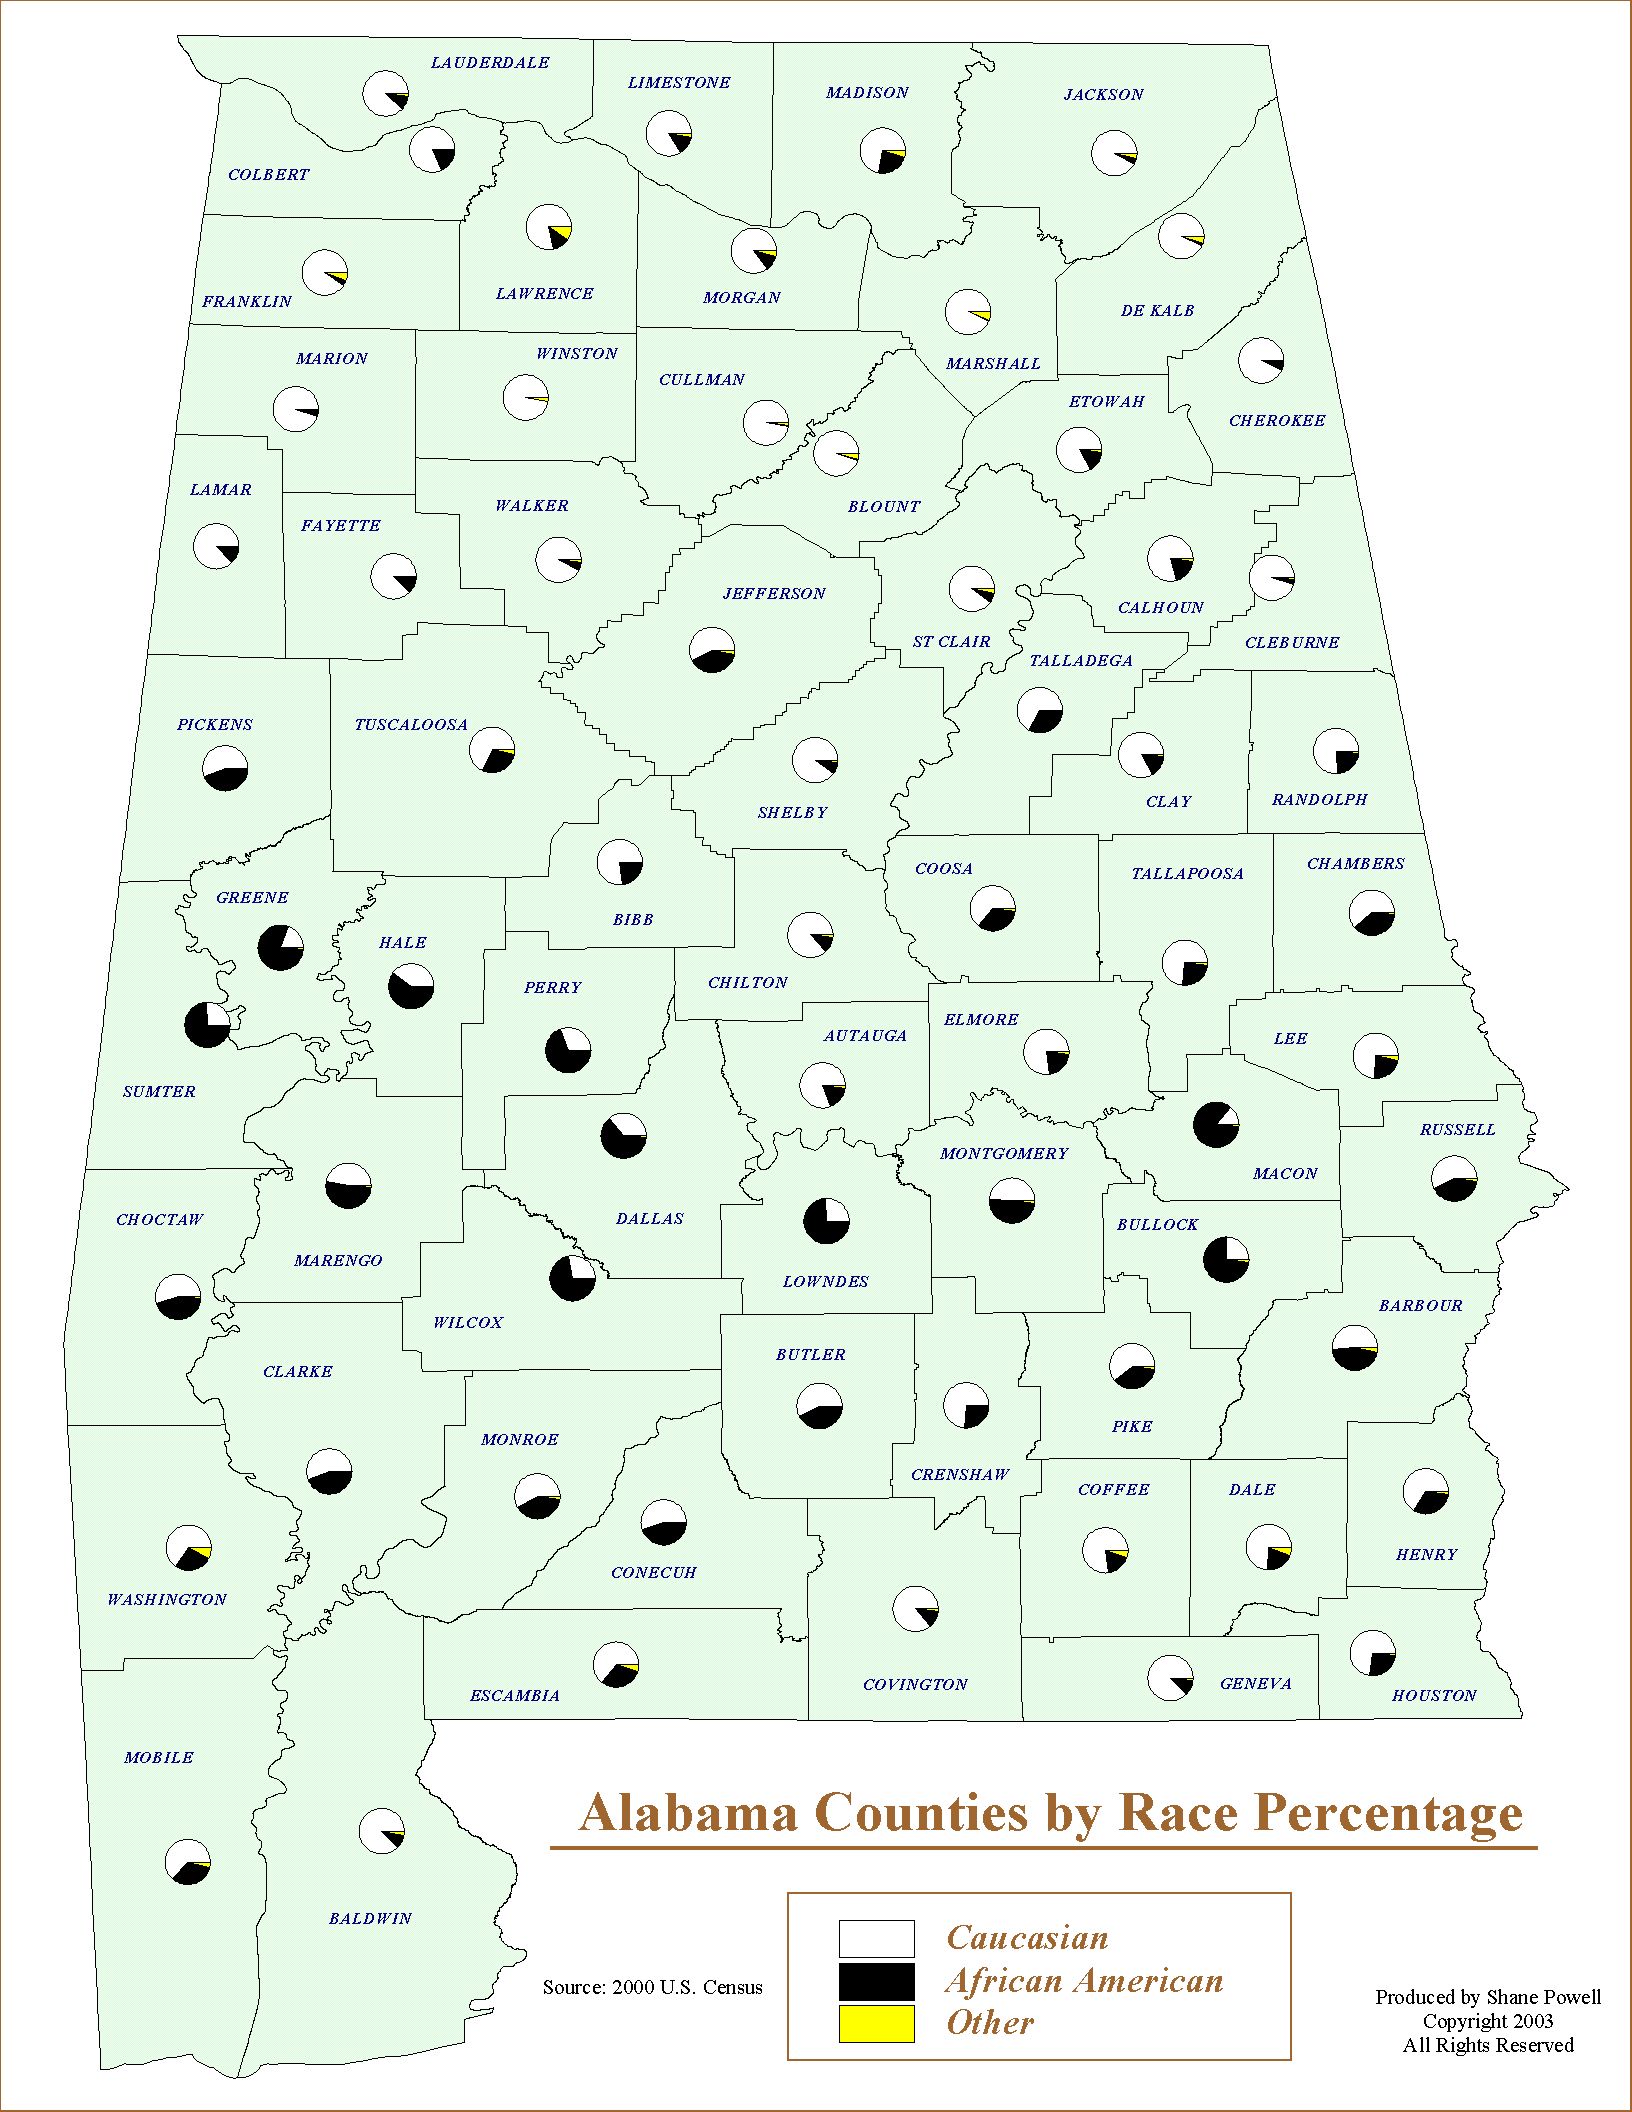
Alabama Population by Race

Percent Distribution by County based on Census 2000

The map contains:

  • Alabama counties labeled by name

  • Each county contains a pie chart designated with white, black, and yellow colors symbolizing percent of Caucasian,  African American, or other populations


https://shanepowell2003.tripod.com/sitebuildercontent/sitebuilderpictures/total_tornados.jpg (270923 bytes)

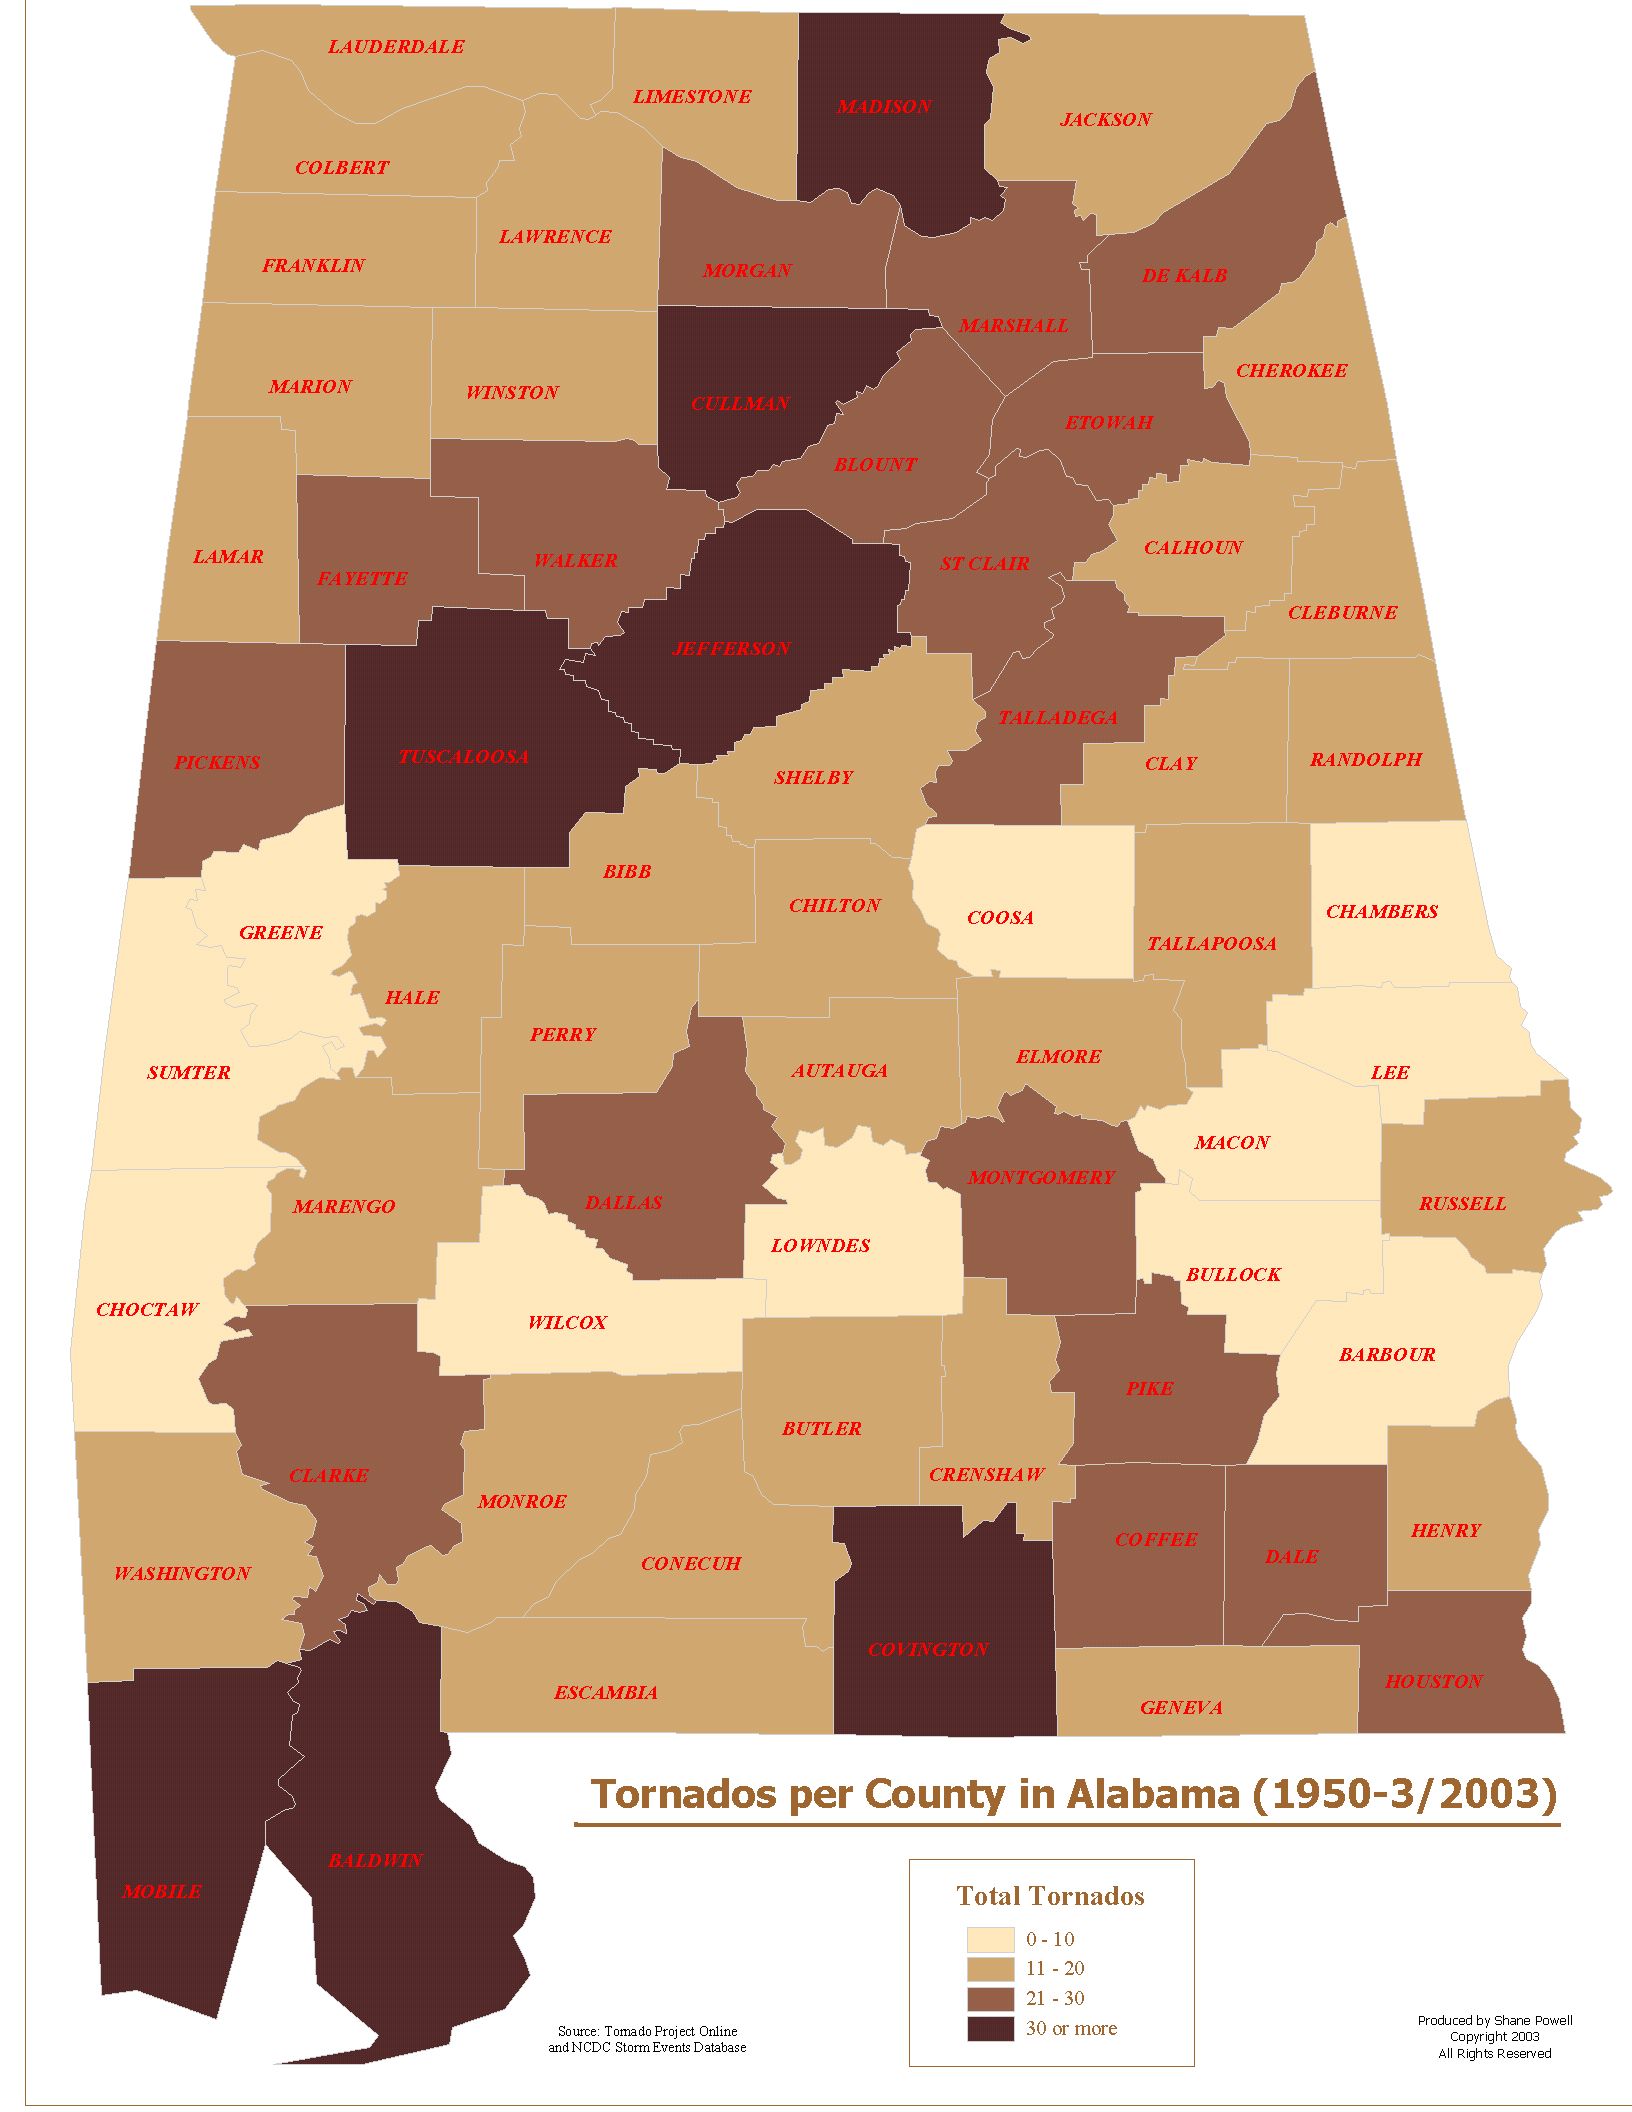
Total Tornados by County in Alabama

Timeframe from 1950 to March 2003

This map was produced from data I compiled from the Tornado Project Online and the NCDC Storm Events Database.

The map contains:

  • Alabama counties labeled by name

  • By using the classification method of equal area with 4 classes, a graduated color legend type was implemented to display the total amount of tornados that touched down in each county from 1950 to March of 2003. 


https://shanepowell2003.tripod.com/sitebuildercontent/sitebuilderpictures/prop_damage.jpg (317886 bytes)

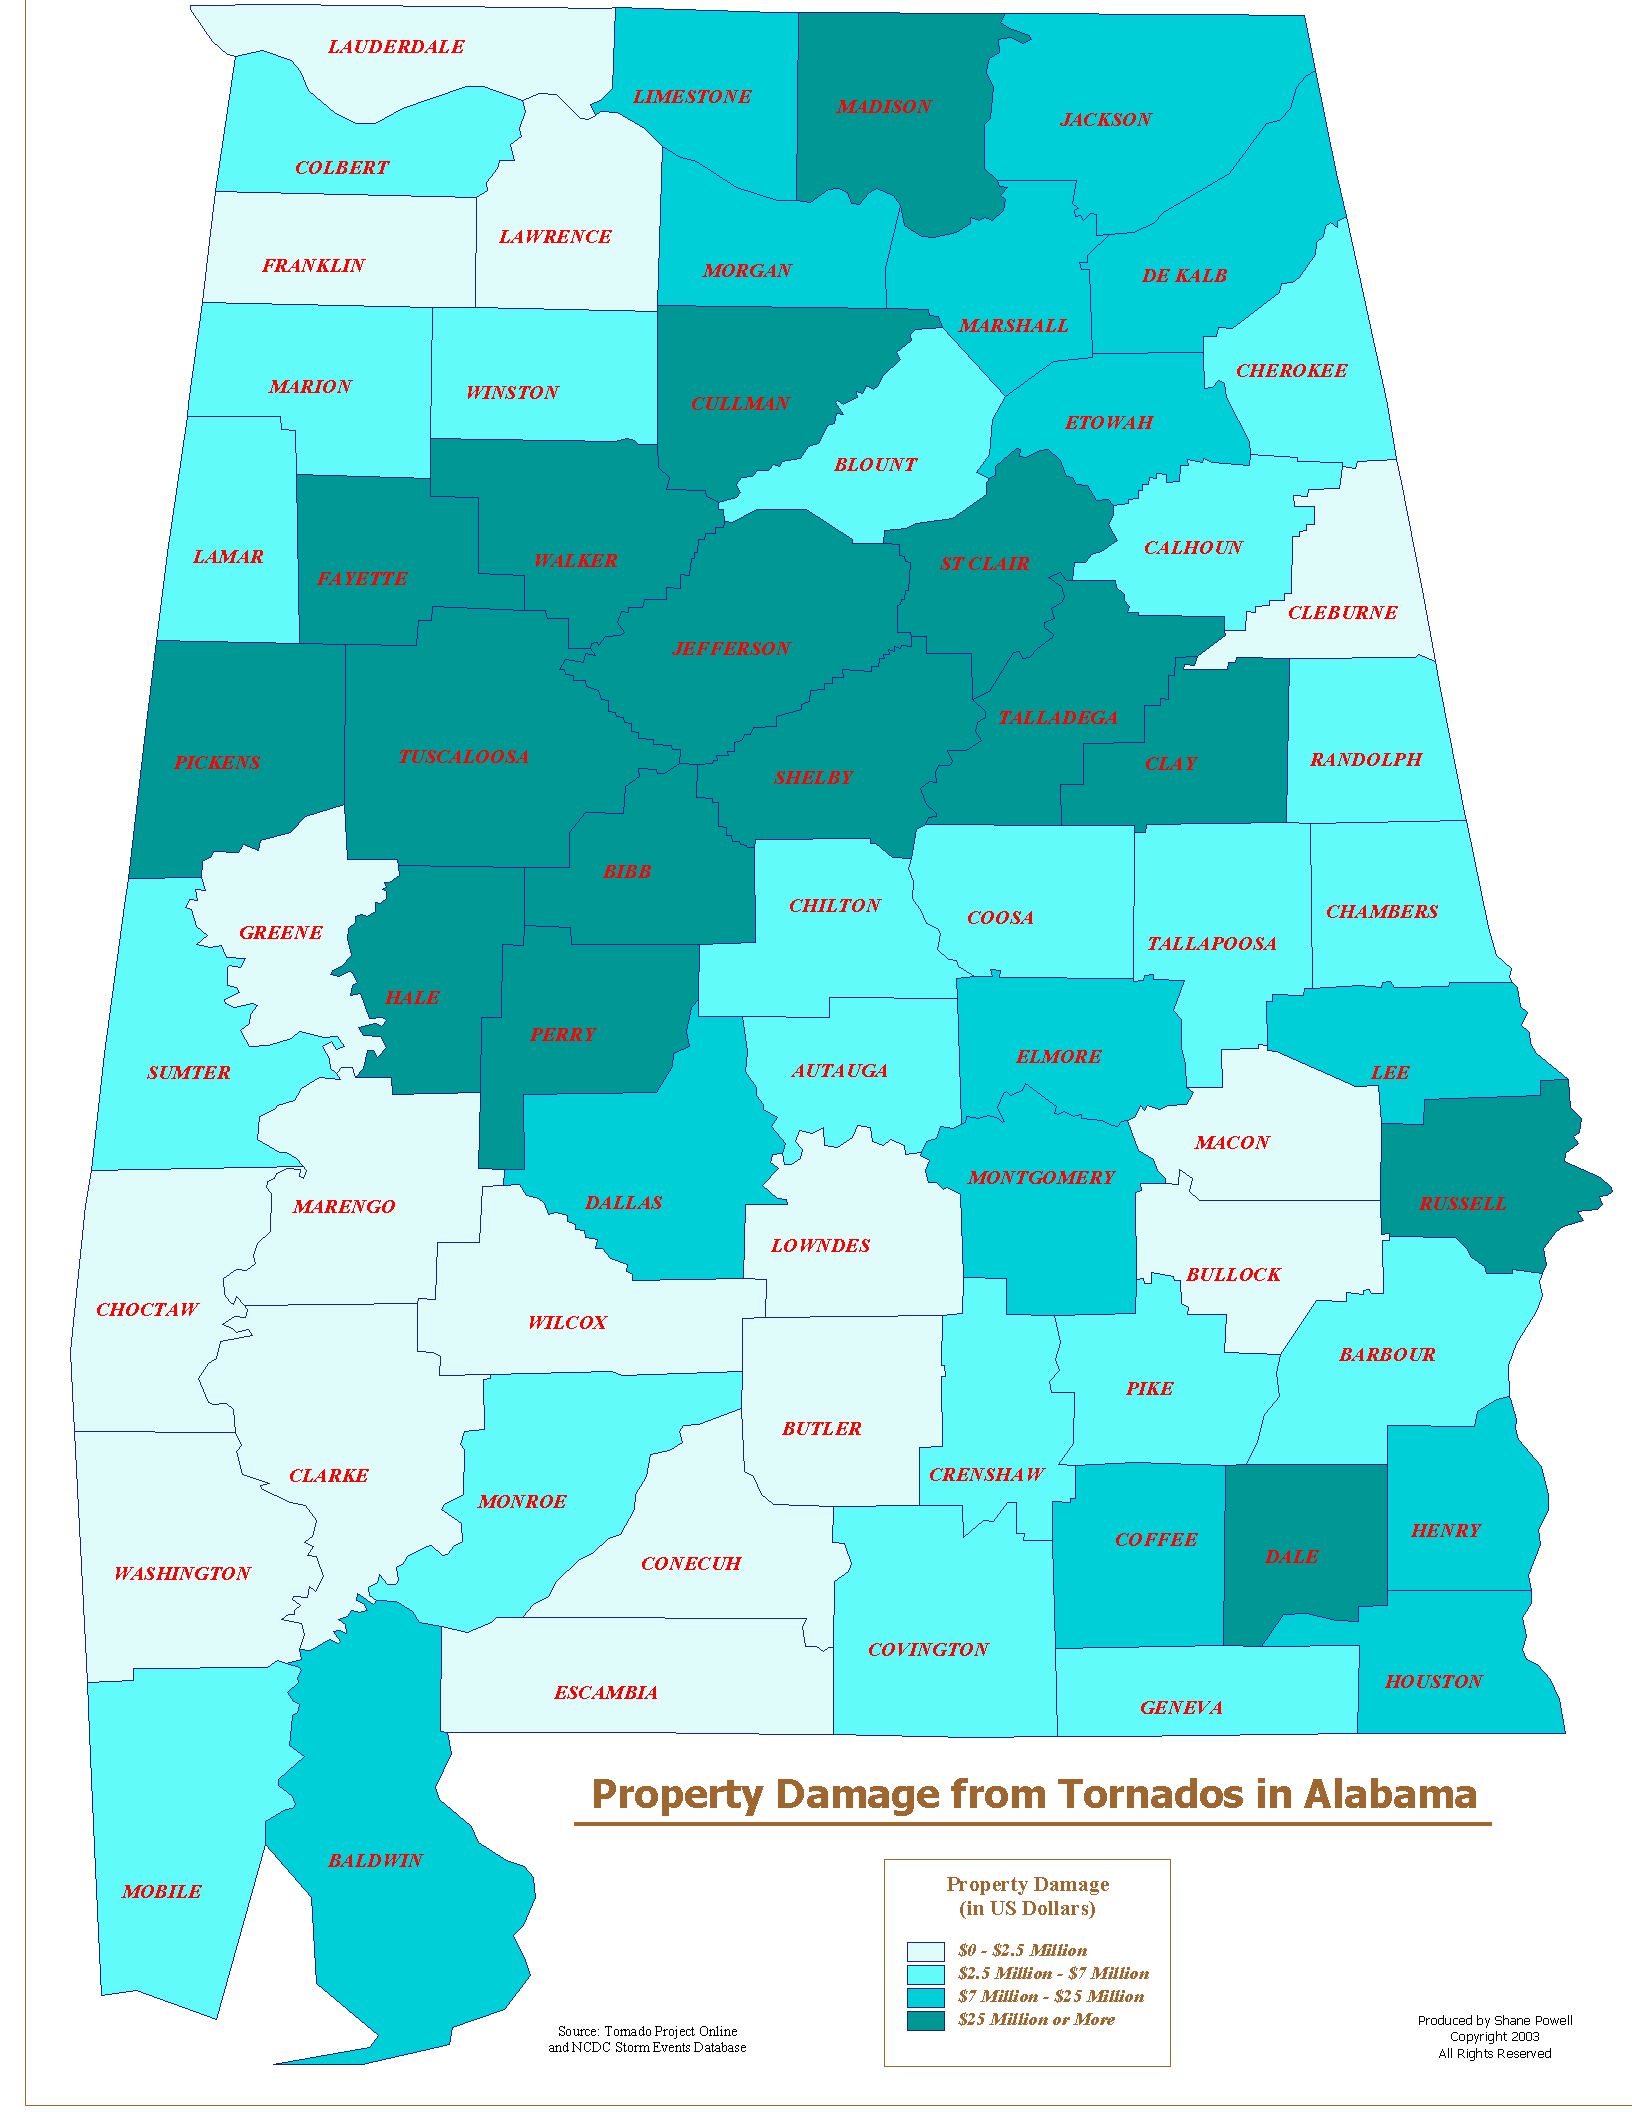
Property Damage from Tornados by County in Alabama

Timeframe from 1950 to March 2003

This map was produced from data I compiled from the Tornado Project Online and the NCDC Storm Events Database.

The map contains:

  • Alabama counties labeled by name

  • By using the quantile classification method with 4 classes, a graduated color legend type was implemented to display the total property damage of tornados that touched down in each county from 1950 to March of 2003. 


https://shanepowell2003.tripod.com/sitebuildercontent/sitebuilderpictures/f_scale_avg.jpg (399250 bytes)

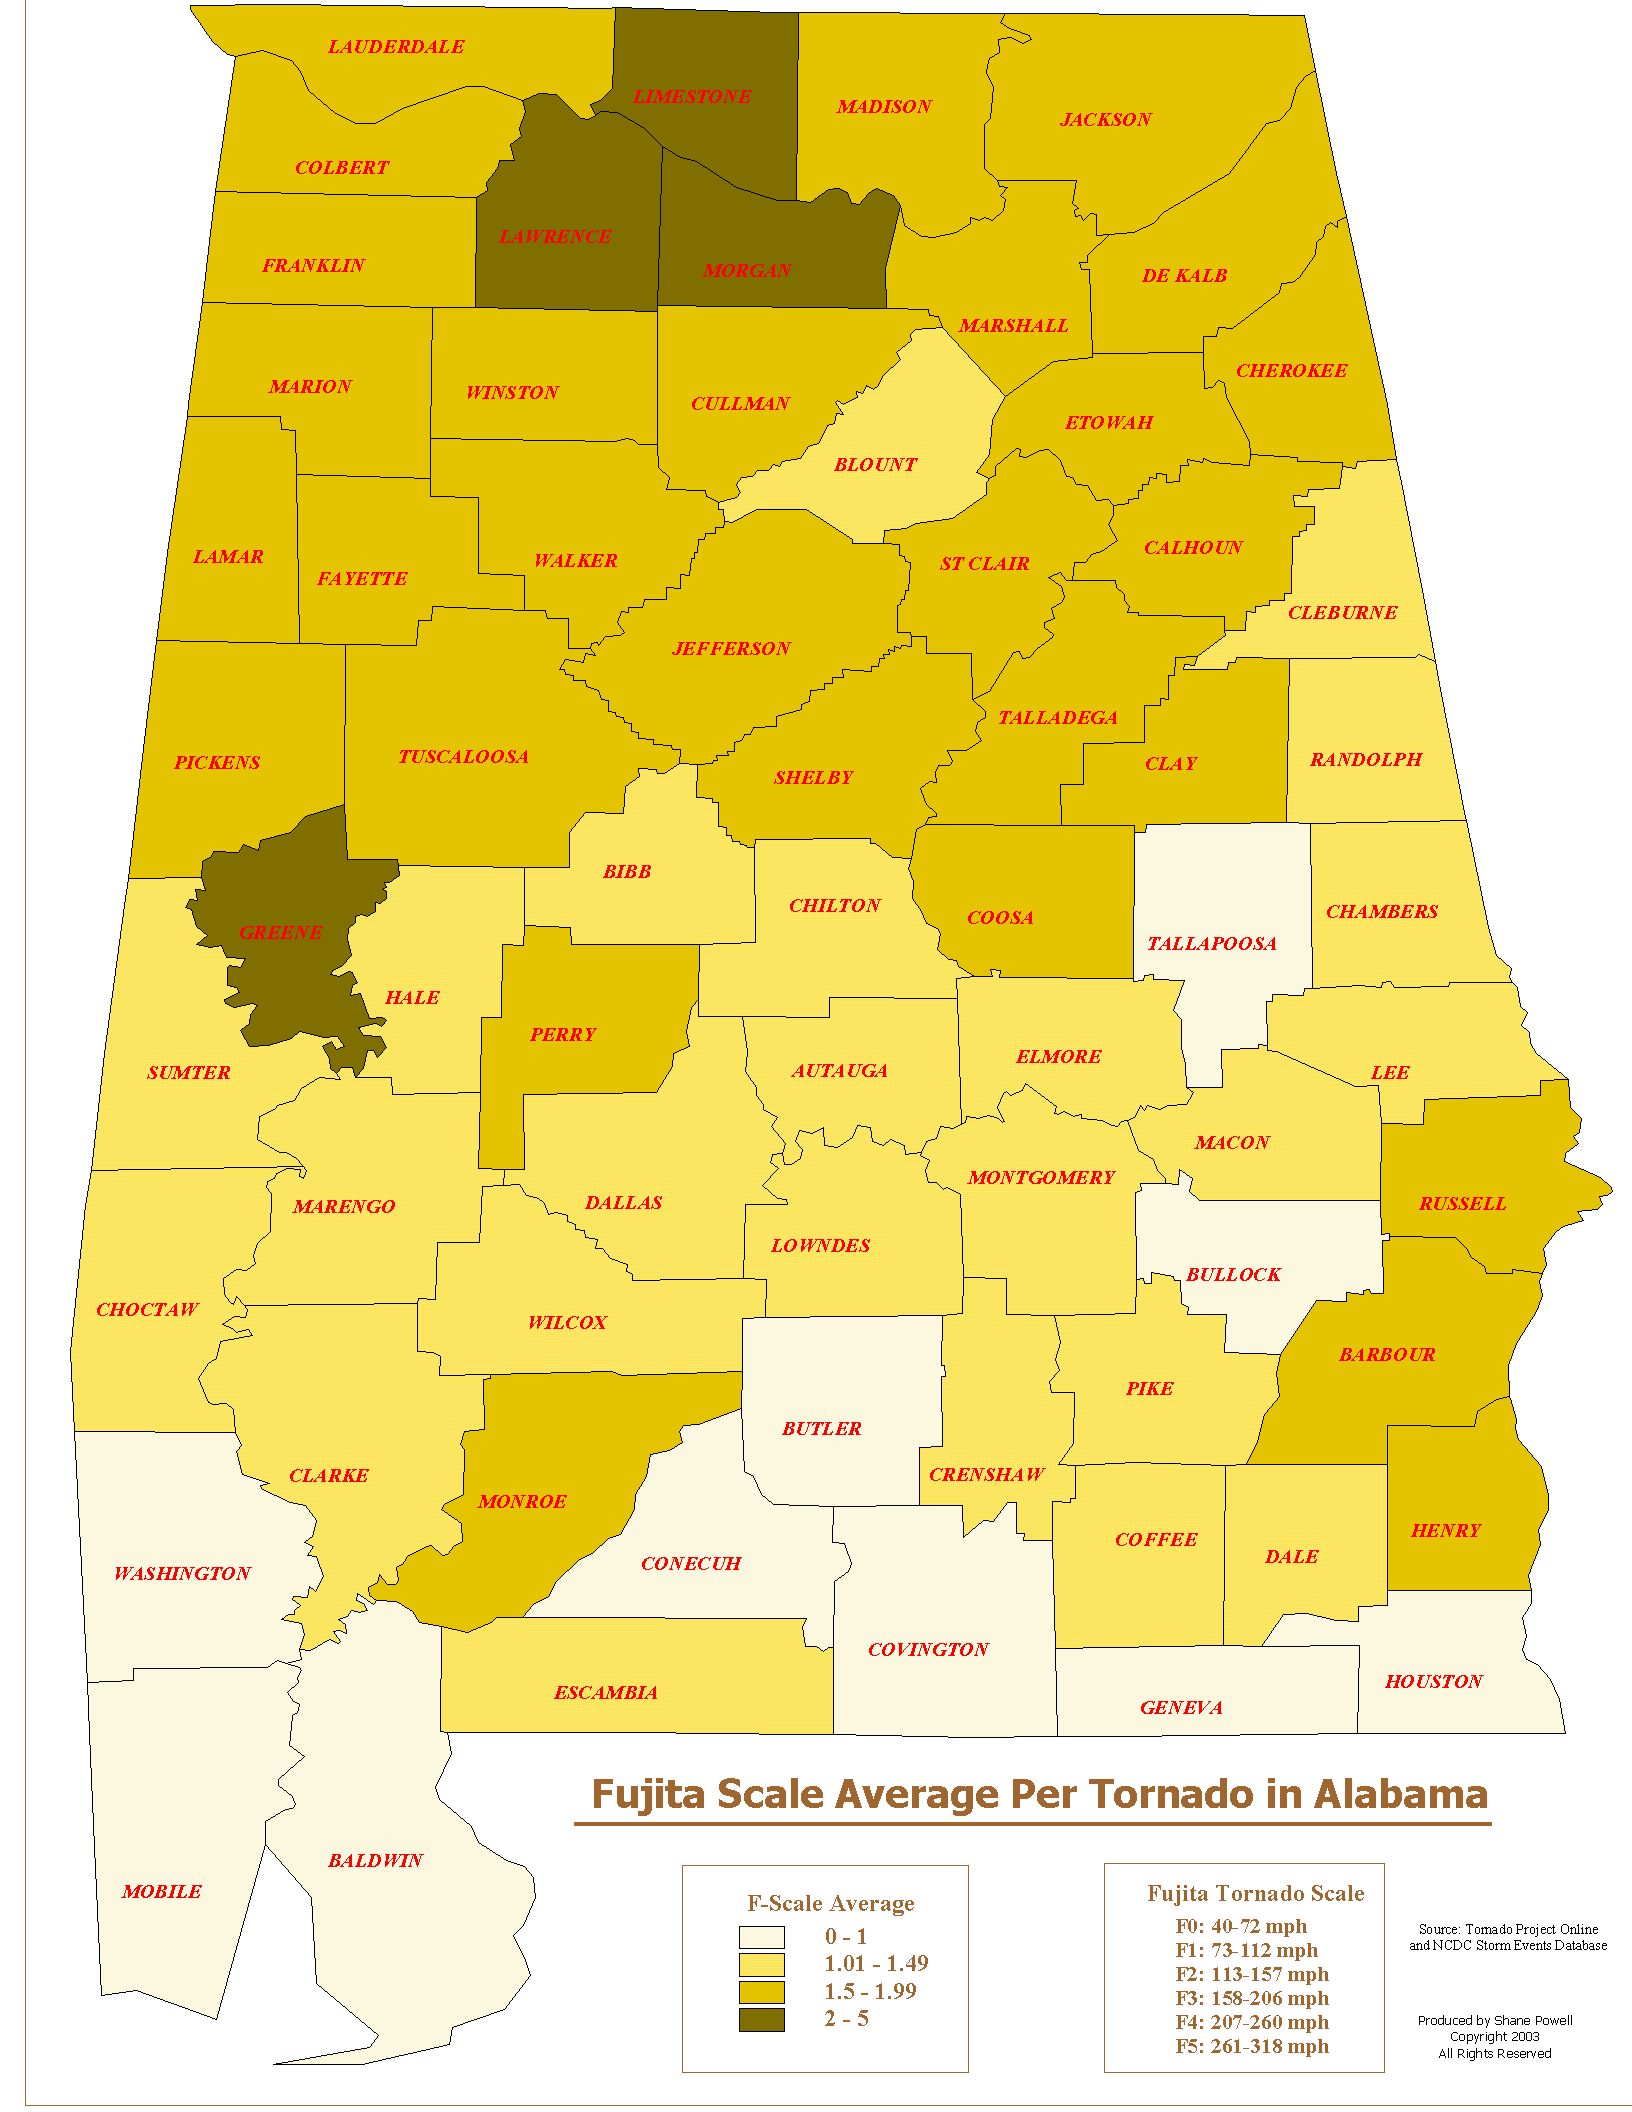
Fujita Scale Average per Tornado by County in Alabama

Timeframe from 1950 to March 2003

This map was produced from data I compiled from the Tornado Project Online and the NCDC Storm Events Database.

The map contains:

  • Alabama counties labeled by name

  • A graduated color legend type was implemented to display the Fujita scale average per tornado that touched down in each county from 1950 to March of 2003. 


https://shanepowell2003.tripod.com/sitebuildercontent/sitebuilderpictures/bham_urban.jpg (173166 bytes)

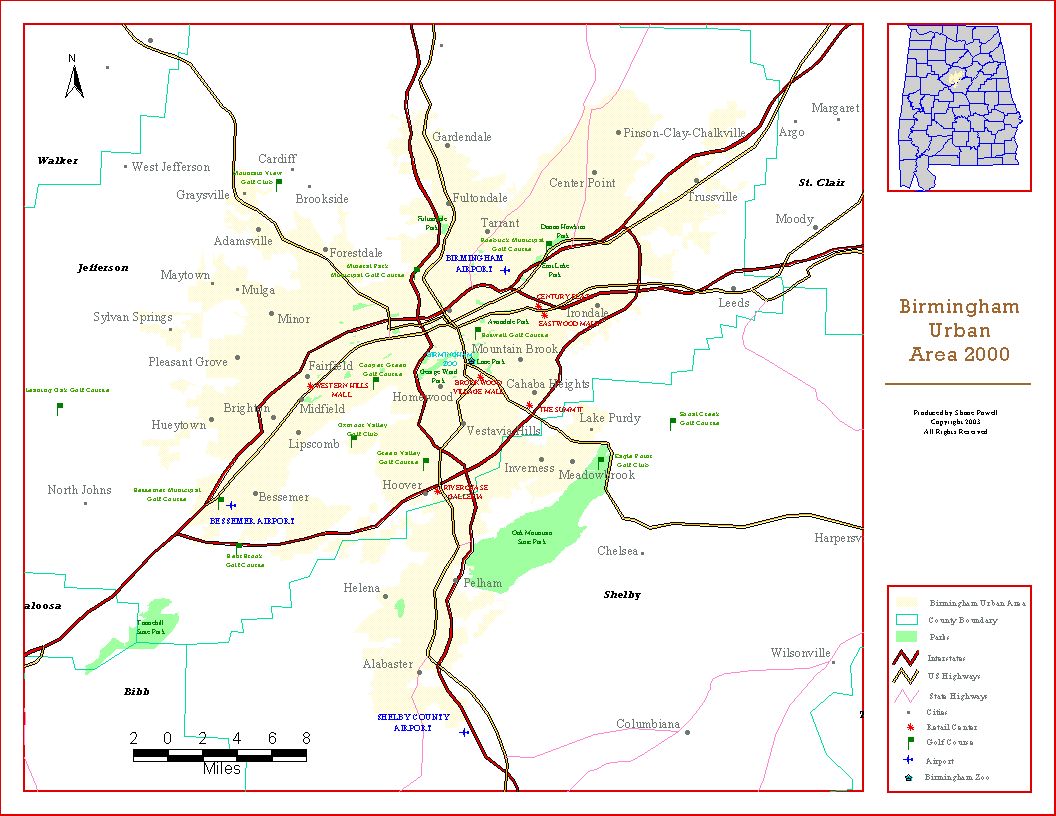
Birmingham Urban Area - 2000

The map contains:

  • Birmingham Urban Area Boundary

  • Point features of golf courses, retail centers, airports, zoo, and cities in the urban area

  • Area features such as county boundaries and parks

  • Line features such as Interstates, US Highways, and State Highways


https://shanepowell2003.tripod.com/sitebuildercontent/sitebuilderpictures/3_dig_zipcodes.jpg (265642 bytes)

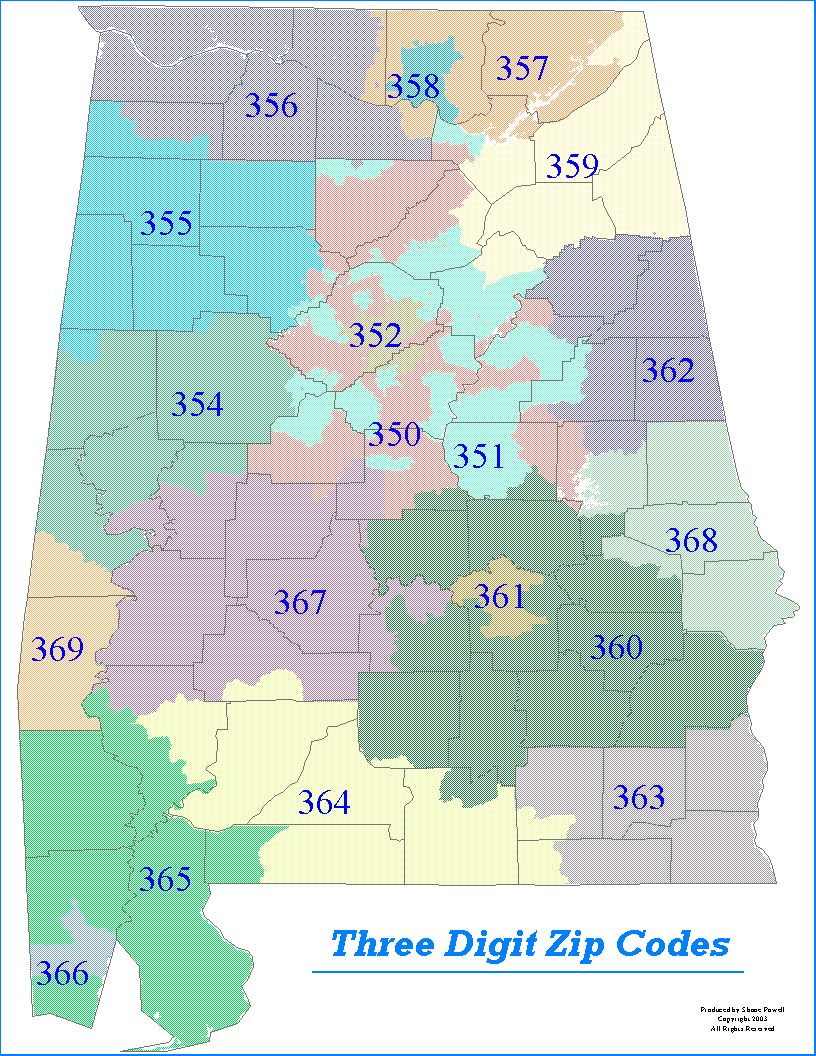
Three Digit Zip Codes of Alabama

The map contains:

  • Three digit zip code prefixes

  • County boundaries


https://shanepowell2003.tripod.com/sitebuildercontent/sitebuilderpictures/jefferson_ethnic.jpg (924592 bytes)

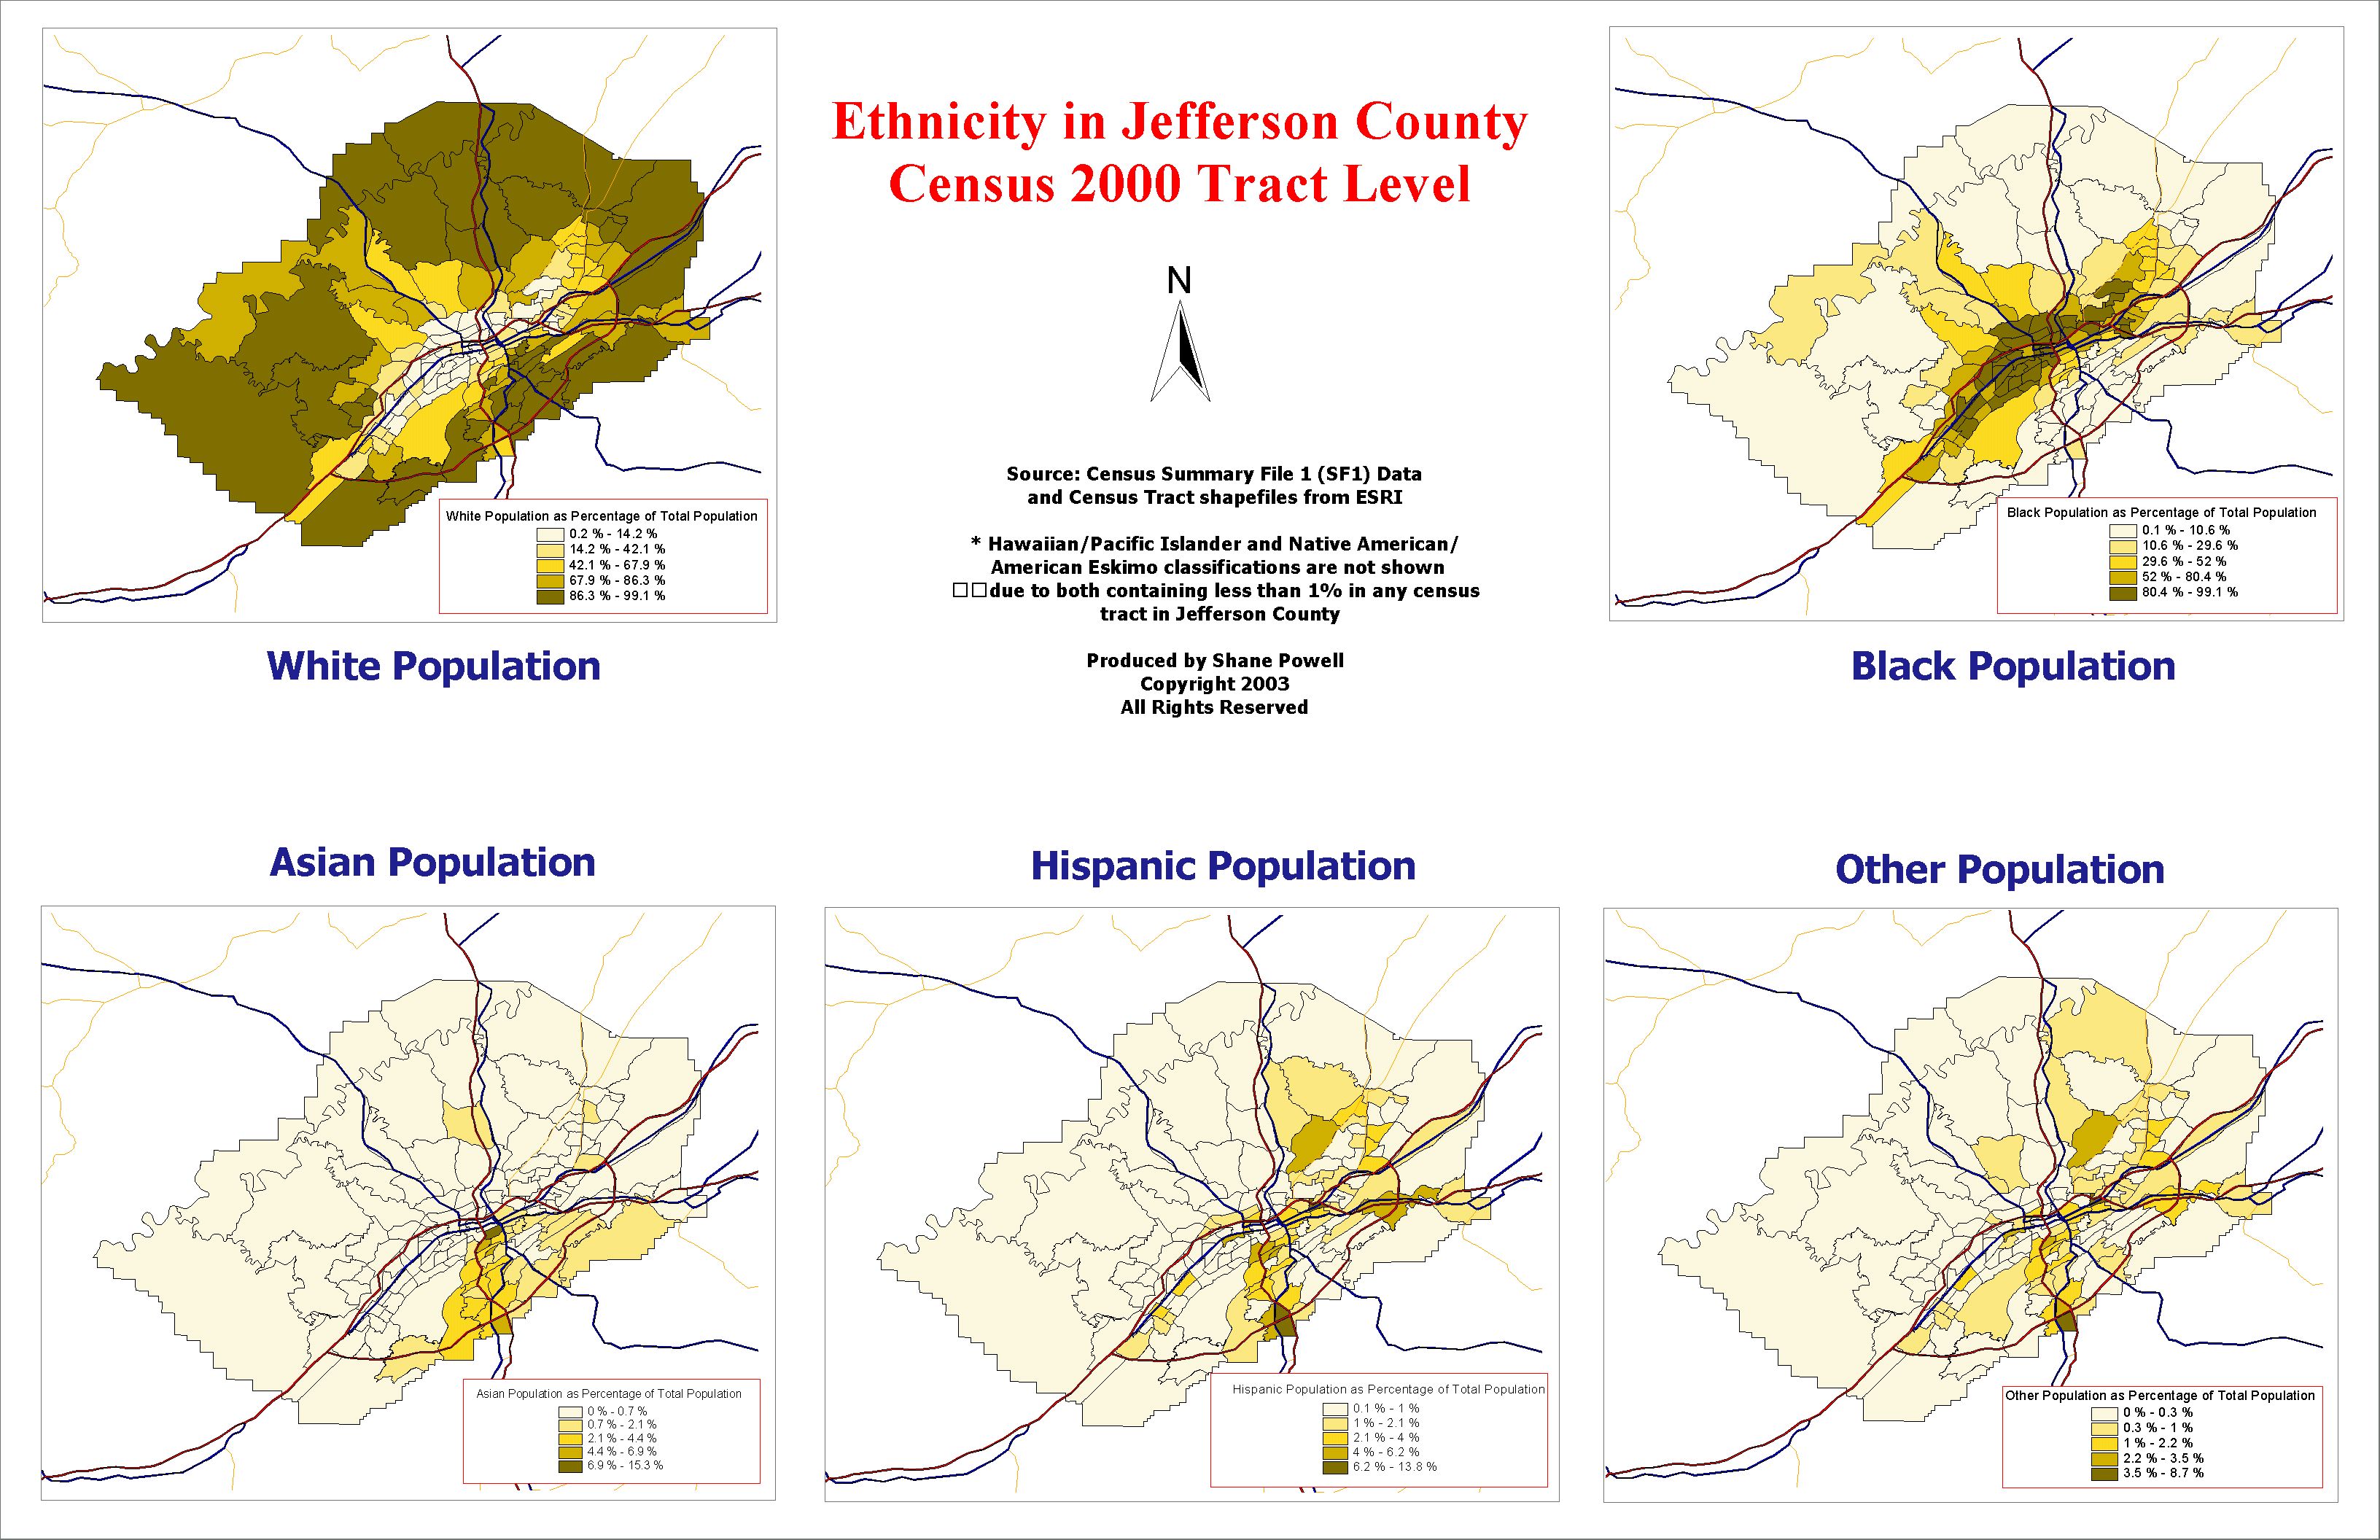
Jefferson County, AL Ethnic Diversity Map

The map is based on Census 2000 Tract level data.

The map contains:

  • Primary, secondary, and major roads in Jefferson County

  • Five different views of ethnic diversity in Jefferson County - White, Black, Asian, Hispanic, and Other (each view shows the ethnic group as a percentage of the total population using the natural breaks classification method)

https://shanepowell2003.tripod.com/sitebuildercontent/sitebuilderpictures/al_pop_den.jpg (867511 bytes)

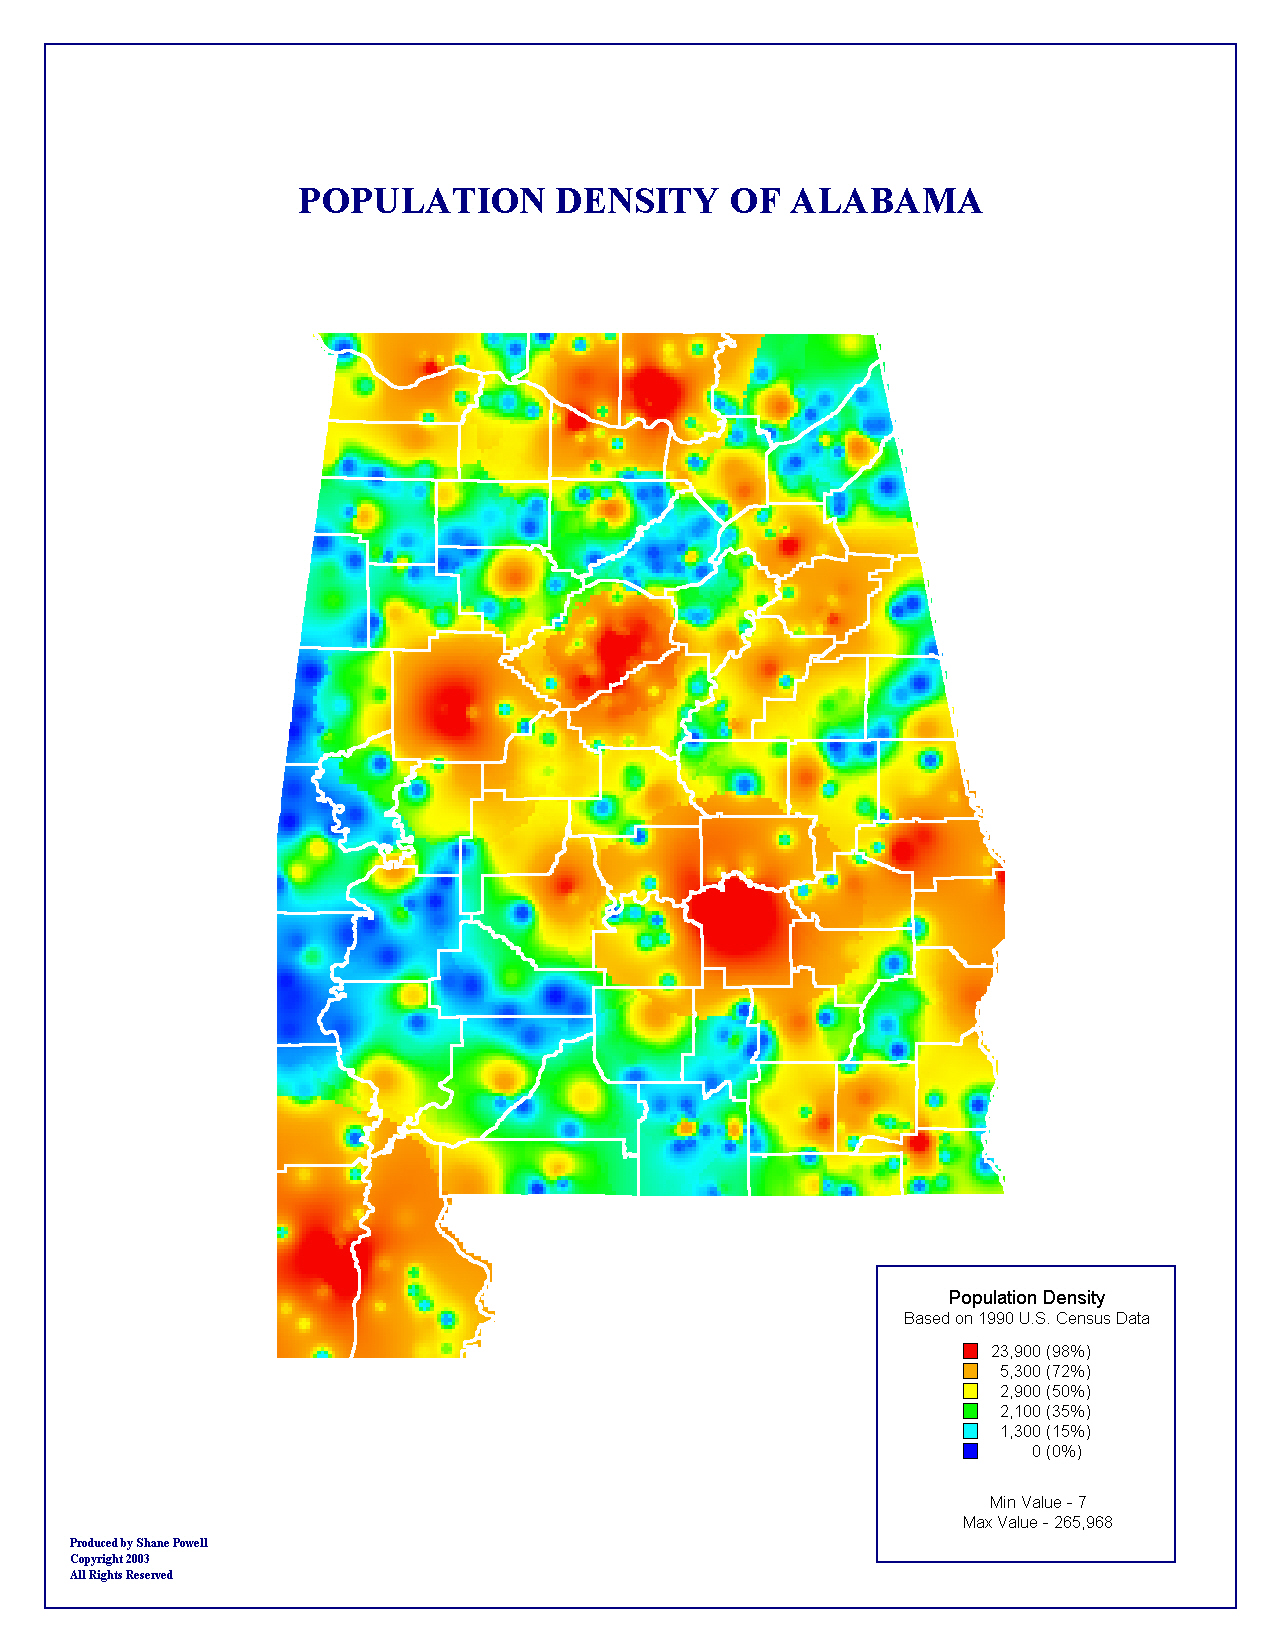
Population Density of Alabama

This map shows a population density grid for the state.


Resume || Sample Maps || Travels

Comments or Questions to:

shanepowell2003@yahoo.com


Copyright © 2003 by Shane Powell